Summary
I've been fighting for the whole day with Prometheus and Grafana. It turns out the documentation about Prometheus and Grafa get outdated very quickly. Let me shed some light on both the problem and the solution.
Intro
I've been trying very hard to setup perfect grafana/prometheus configuration that I can apply to all of my clusters. This requires me to configure both of those services from YAML files, so that both prometheus and grafana start with prope configuration in place that are ready to be used. I've even been able to setup dashboards upon grafana pod start. However, there were few problems along the way. Let's start with my target setup:
- Kubernetes 1.9 single-node using kubeadm
- Prometheus 2.1.0
- Grafana 5.0.0-beta1 - the freshest you can get
The problem
Everysthing started with prometheus. I have installed Prometheus using official helm chart. Unfortunately the default installation (I have customized only the Prometheus image to 2.1.0) has had problem with one scraping job.
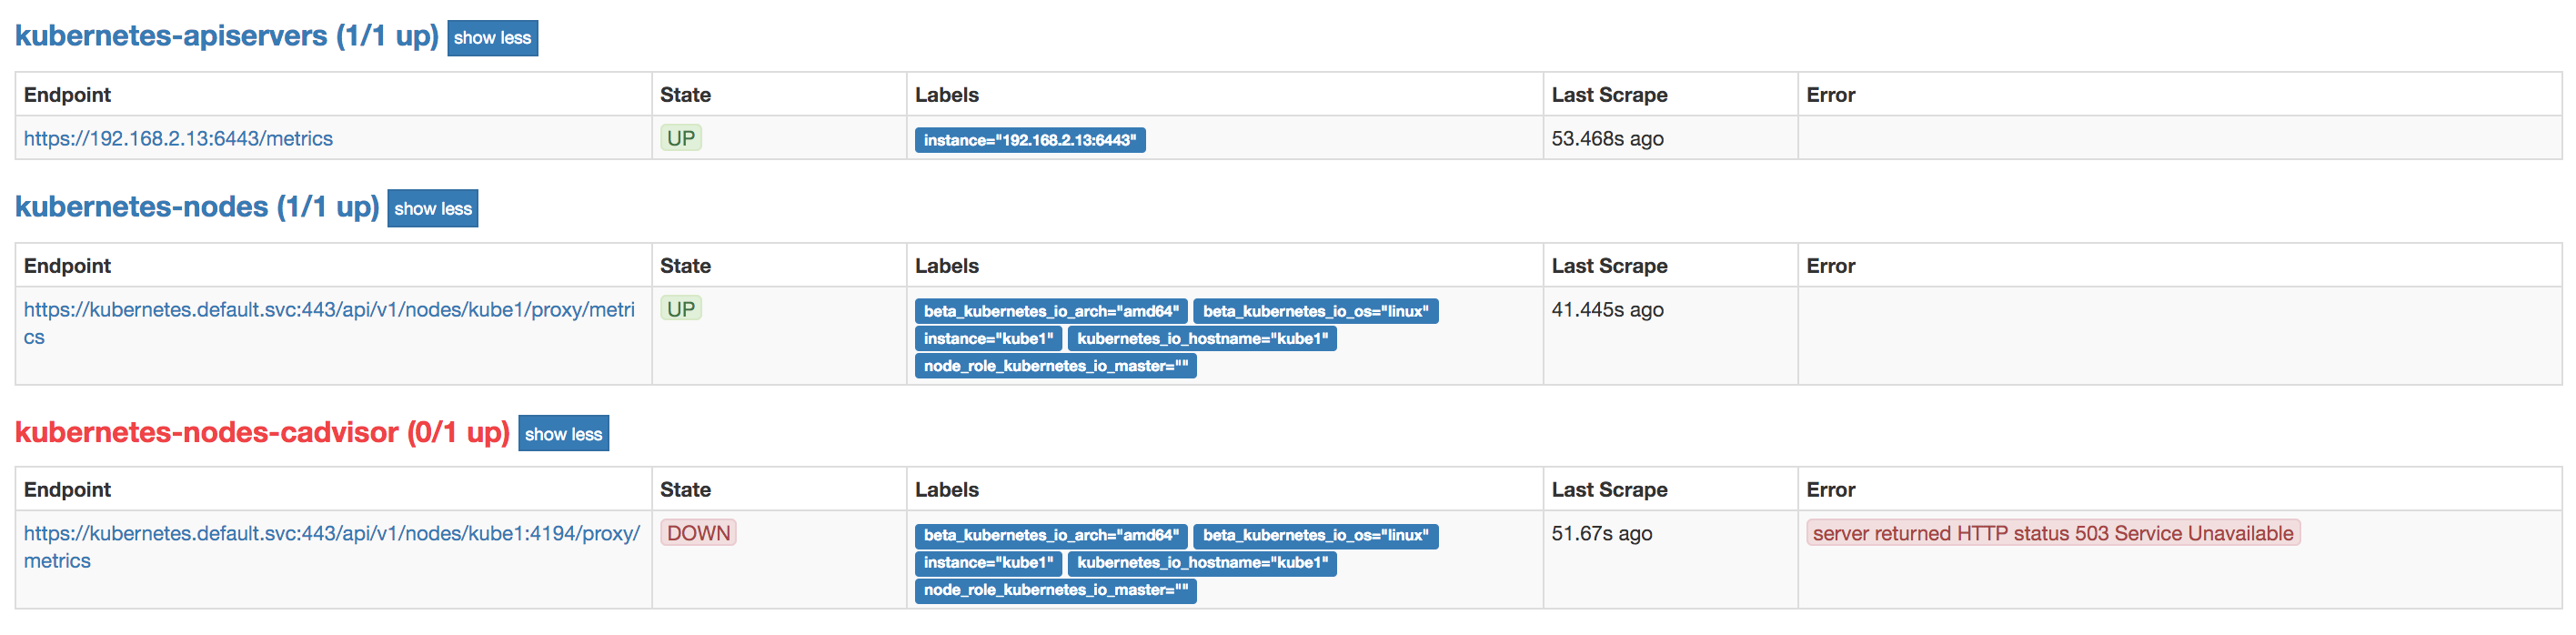
It was the cAdvisor job that was failing. cAdvisor is a Kubelet component that exposes containers' metrics as an API endpoint. The metrics include CPU usage, memory usage and many more. Basically those are the metrics you usually want in your grafana dashboard.
After few hours of investigating what the problem is, it turns out that the default Prometheus helm values.yaml had an old configuration for cAdvisor. It had support for kubernetes < 1.7.3. I have created a PR that should fix this soon (you can track it here: https://github.com/kubernetes/charts/pull/3684).
Conclusion
If you want to start with Prometheus and you have unsuccesfully tried helm chart, you can now just copy and paste cAdvisor configuration from my PR and enjoy frictionless Prometheus experience.
You can also see my full original Prometheus values.yaml here.
In the next posts I will show you how to connect prometheus to grafana in the easiest way as well as how to deploy grafana with pre-configured data sources and dashboards.